
Server & Uptime Monitoring
A server resource and uptime dashboard: up/down status, CPU, RAM, disk per mount point, network traffic, and load average.
- Client
- Lembaga Filantropi Nasional
- Industry
- IT Infrastructure
- Category
- Infrastructure & Cloud
- Year
- 2026
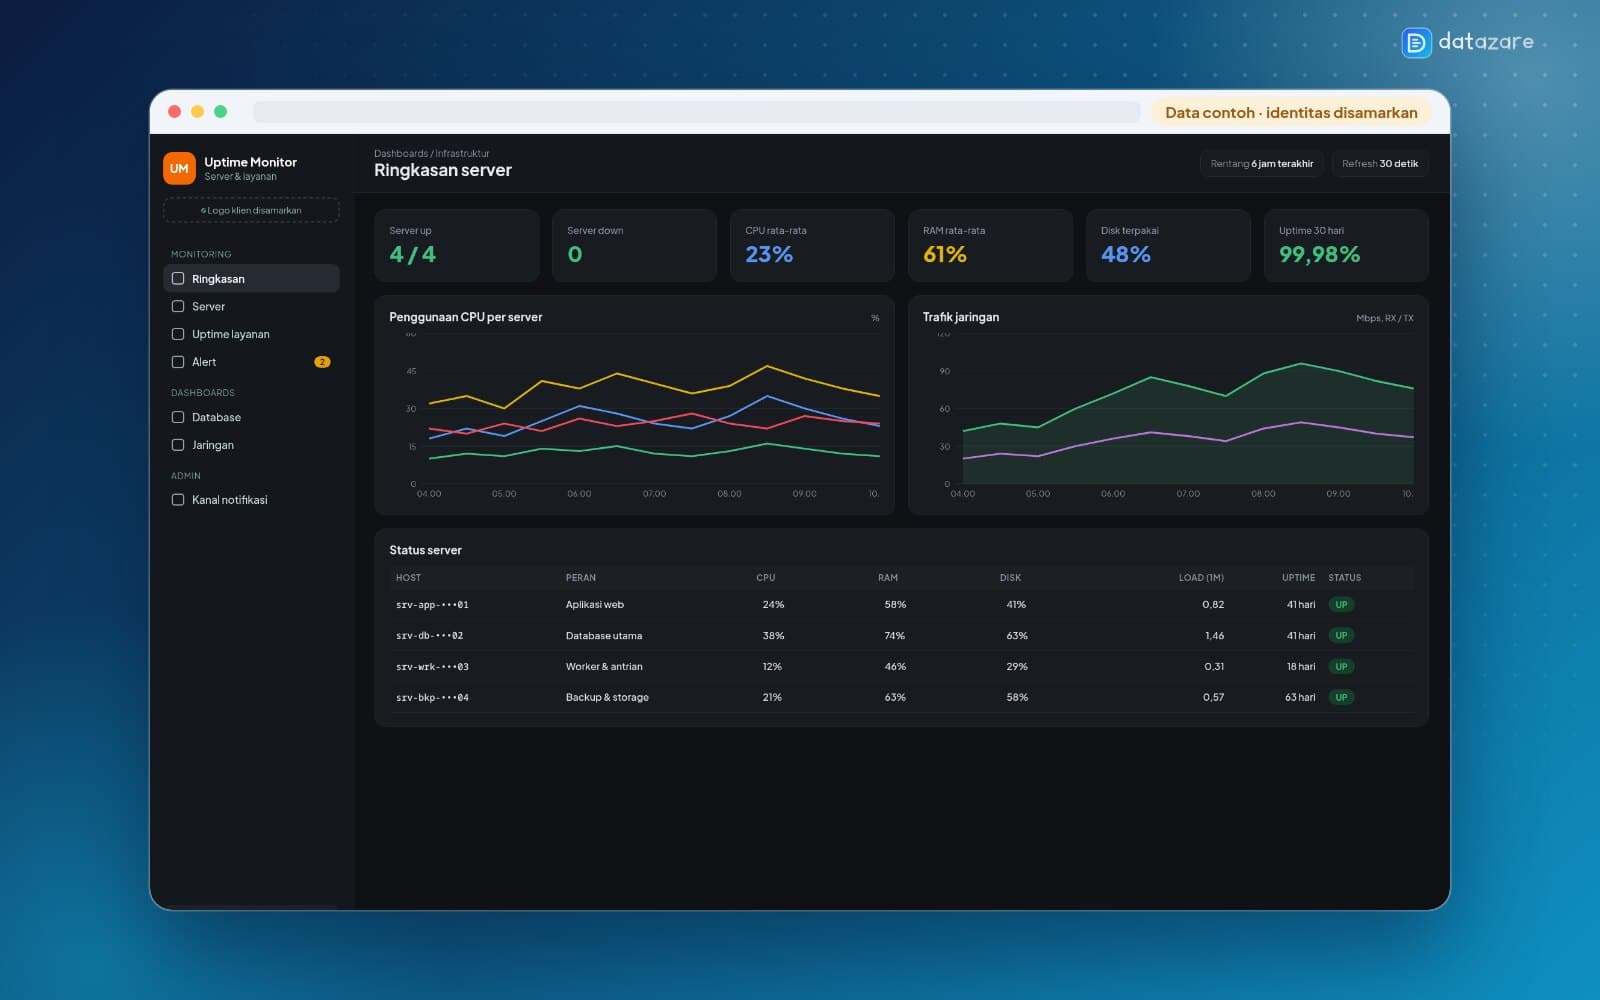
4
Servers monitored
30 seconds
Refresh interval
CPU · RAM · Disk · Net
Key metrics
Challenge
Server issues were often discovered only after users reported them, with no historical data to analyze resource spikes.
Solution
We deployed a monitoring stack based on Prometheus node_exporter and Grafana with localized dashboards: server up/down, average CPU & RAM, disk usage per mount point, network RX/TX traffic, load average, and uptime since boot.
Dashboards refresh automatically so the team can act before issues affect users.
Other projects
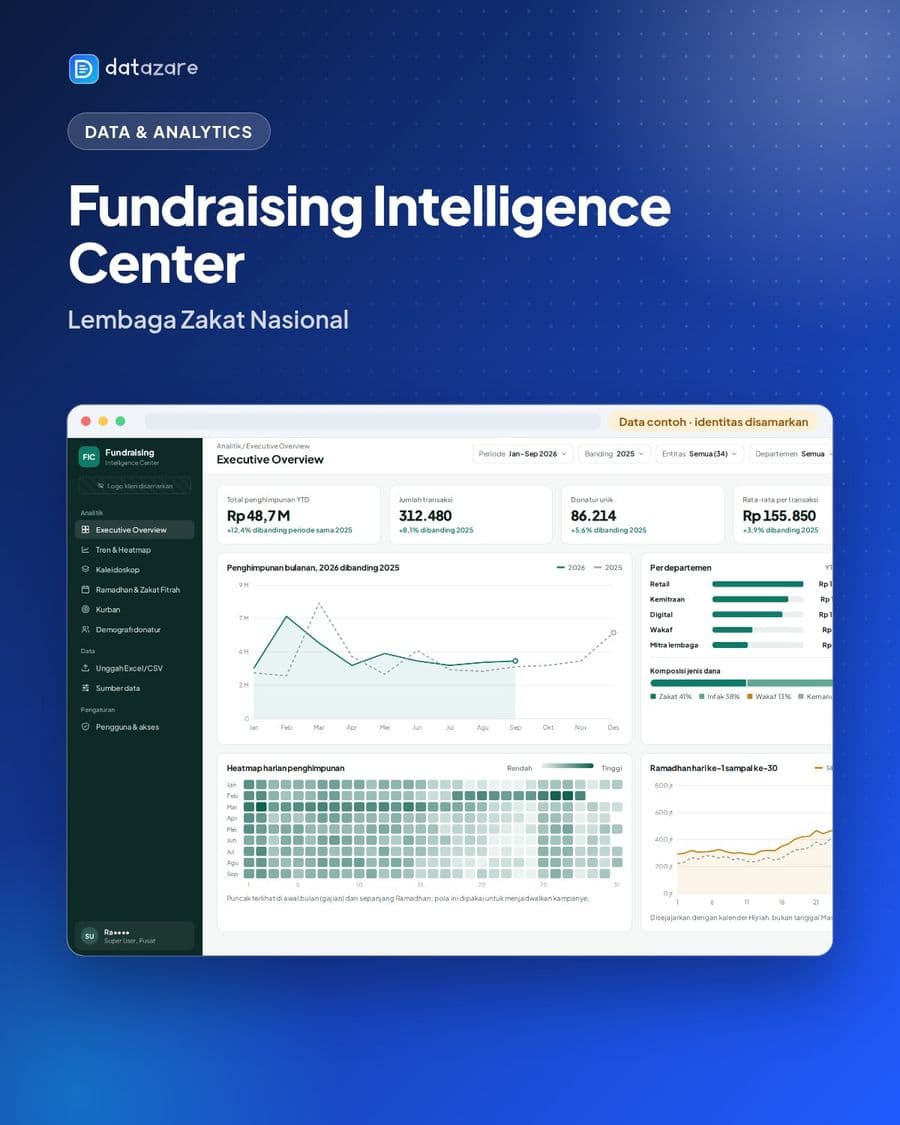 Data & Analytics
Fundraising Intelligence Center
Lembaga Zakat Nasional · Fundraising Analytics
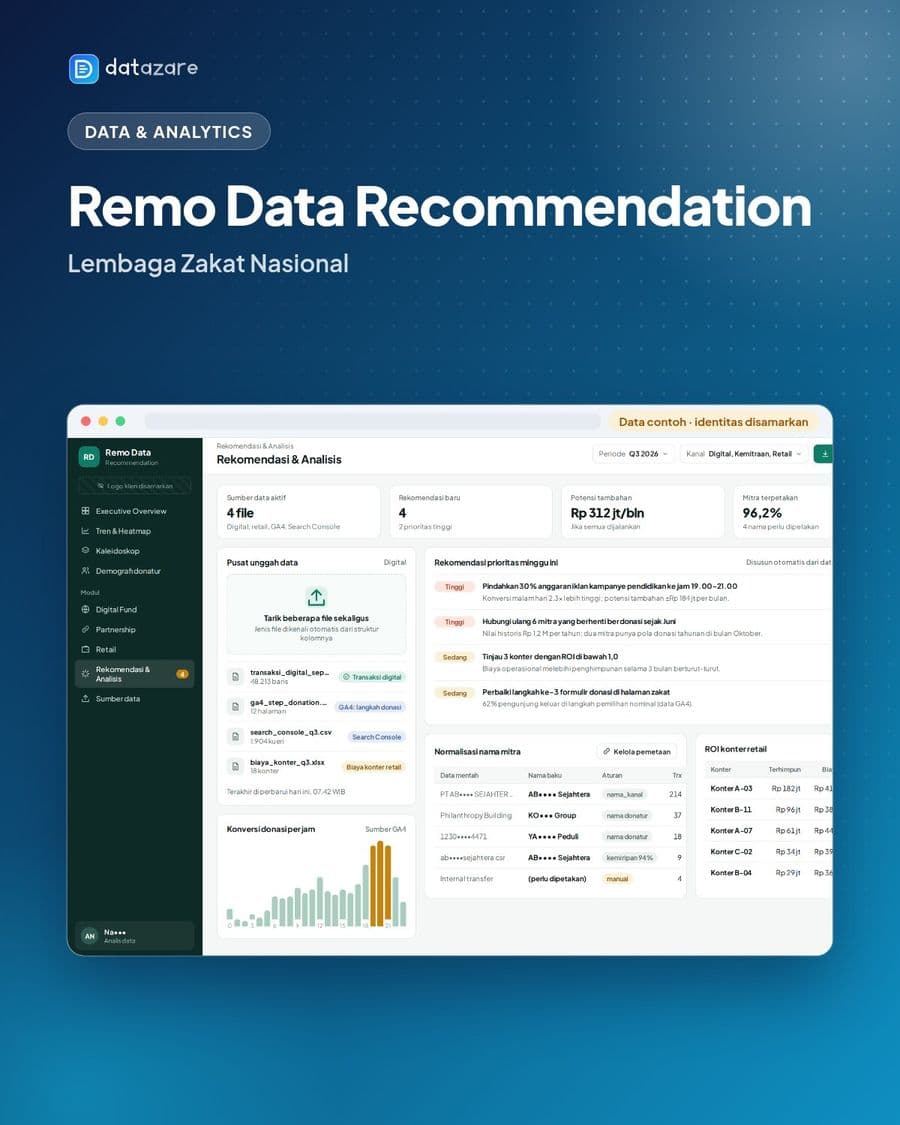 Data & Analytics
Remo Data Recommendation
Lembaga Zakat Nasional · Digital Donation Analytics
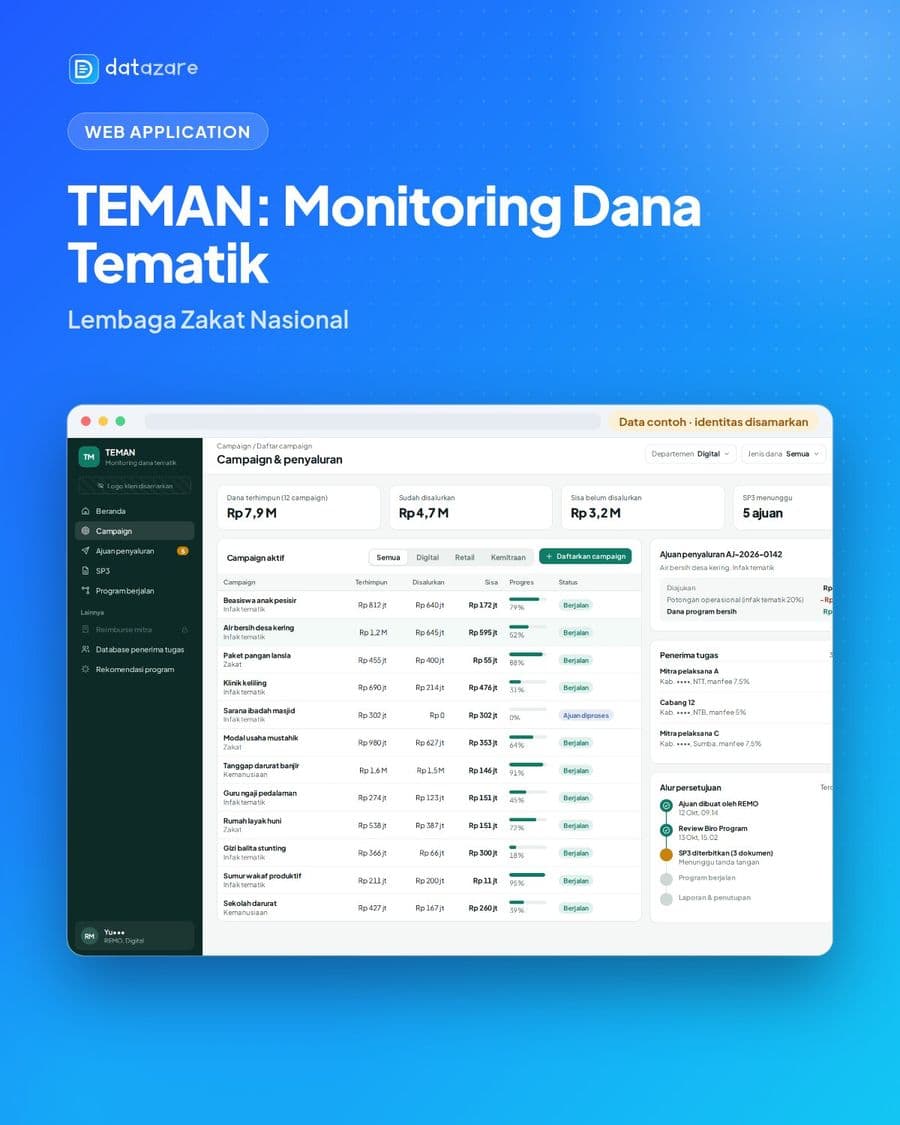 Web Application
TEMAN: Thematic Monitoring & Allocation Network
Lembaga Zakat Nasional · Program Distribution
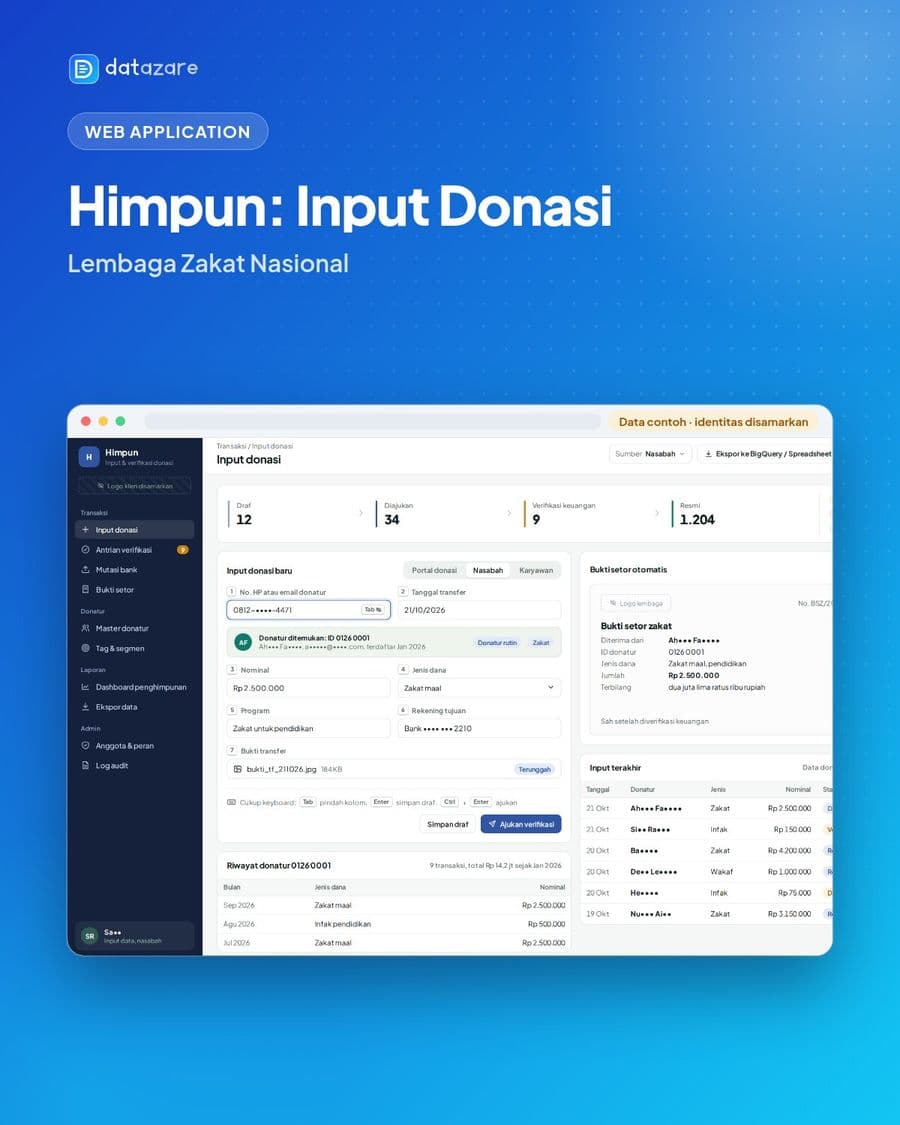 Web Application
Himpun: Donation Entry App
Lembaga Zakat Nasional · Donation Operations
Facing a similar challenge?
Tell us what you need — we will help you design the solution.